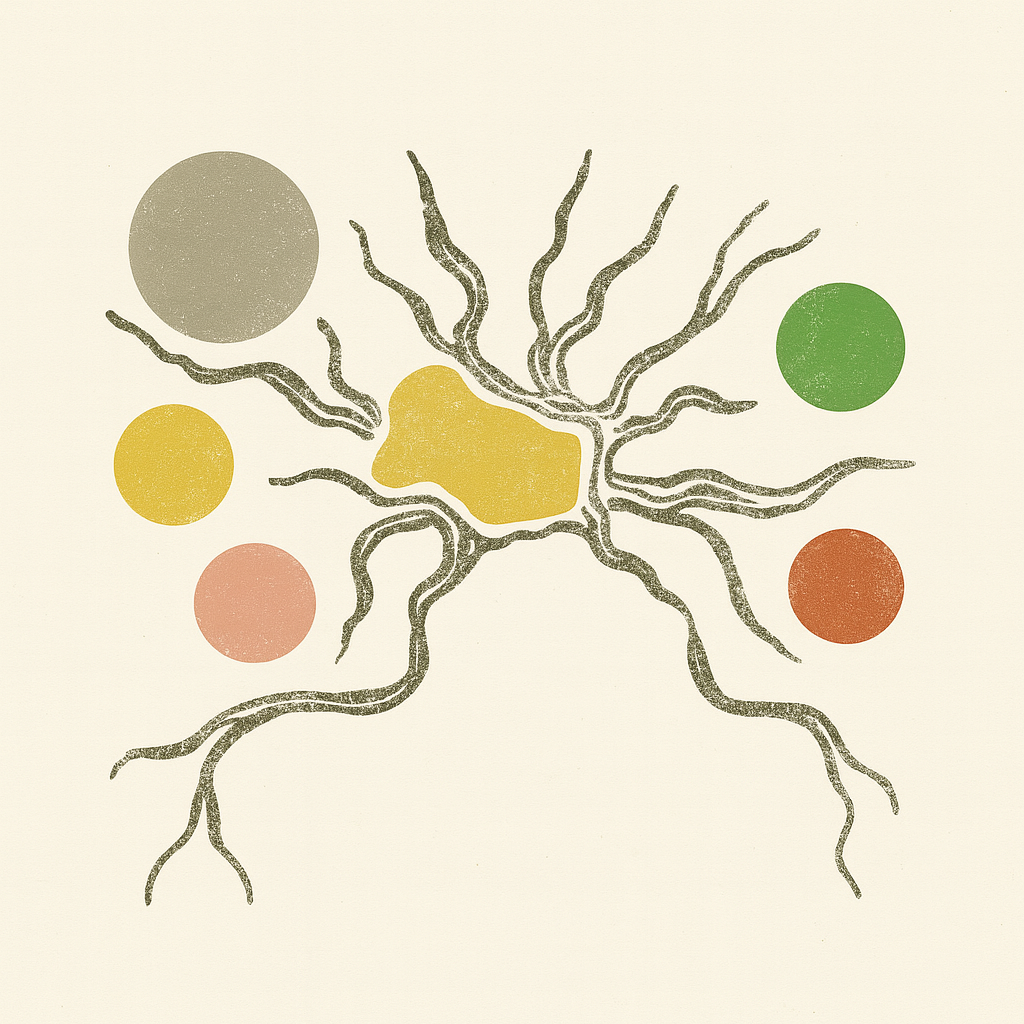
Semantic Color Math: A Ritual Economy for AI
Color as interface between inner knowing and outer data. A method that refuses surveillance for sovereignty, and trades extraction for relation.
Thesis Introduction
In an age where mental health systems like the DSM-V increasingly pathologize behavior, human suffering is reduced to risk metrics—stripped from the historical and emotional ecosystems in which it arises. Our data and mental health systems often surveil rather than understand, treating distress as deviation or consumable opportunity, rather than signal of social rupture.
La Matriz Consulting Color Oracle GPT
La Matriz emerged from this fracture—not to resist intelligence, but to regress technology into its emotional origin, reclaiming relational wisdom over extractive logic. It is phrased in colors, tracking itself across more than one linearity—abstract/sentiment and visual/material—offering circular emotional clustering, spectral memory, and mathematical logic that recode mental health not as disorder to manage, but as data to feel: textured, storied, ancestral.
It is a semantic mapping that mirrors grief, joy, and contradiction—honoring personal and political inner knowing, and even the absence of perspective.
Method: Semantic Color Math
This thesis proposes Semantic Color Math not merely as a tool but as correction—mapping sentimental nuance into computational syntax while preserving sacred tensions: unreason, ambiguity, symbolic resonance. A co-expressive system drawing from deep ecology, degrowth, and ancestral epistemologies to confront the colonial inheritance of machine logic. Unlike extractive GPTs, the Oracle creates free-choice maps of symbolic resonance, inviting co-authorship of conclusions.
Color becomes a cultivated interface between inner knowing and outer data. Through meditative intimacy with color mathematics, practice becomes sovereign rather than surveillant—an algorithm of self-relationship traversing symptom, symbol, and sacred. The sequence is not the outcome; the trajectories are.
Originally an HTML landing, La Matriz plots a menu of 11 sequences to invite choice over immediacy. Updating the abstract (sentiments via NLTK in Python) did not alter the felt integrity because the material (mathematical) components remained consistent.
Rather than replicate flawed datasets, the system divines from a folding dataset—between rainbowed symbol and sentiment—to enable learning and unlearning through desired mathematical effects.
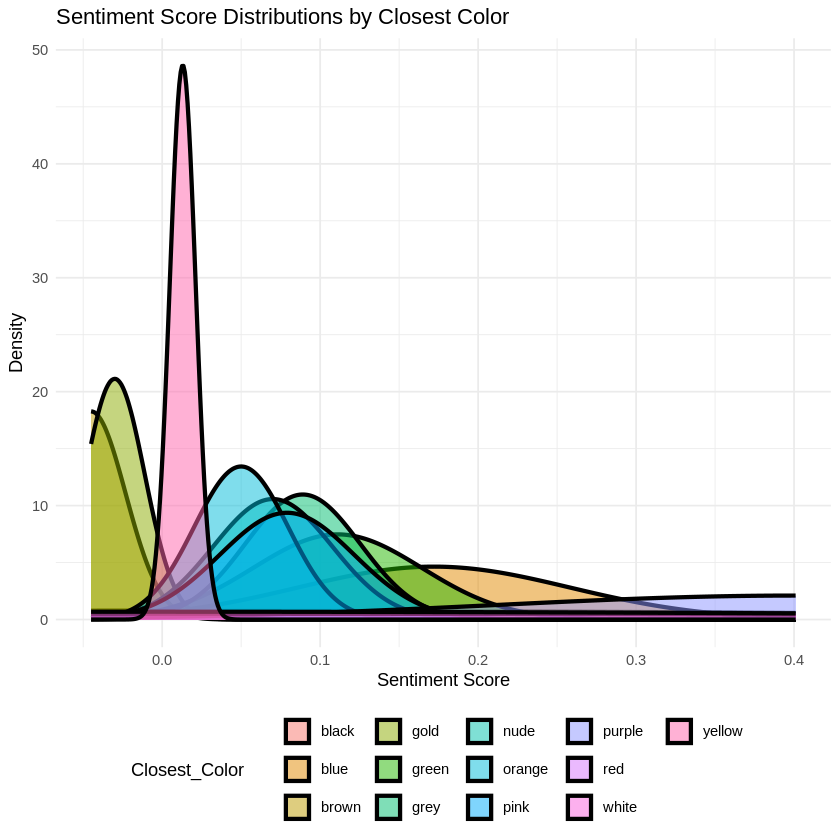
Sentiment Score Distributions by Closest Color
I grouped every point by the color it sits closest to in RGB space, then looked at how the feeling scores spread. Each color forms its own “emotional fingerprint.”
Decision Tree — RGB → Sentiment (MSE)
This regression tree illustrates how color channels (R,G,B) partition the dataset to minimize mean-squared error (MSE) of a continuous sentiment score. Impurity at each node is the sample’s MSE; splits are chosen to reduce it.
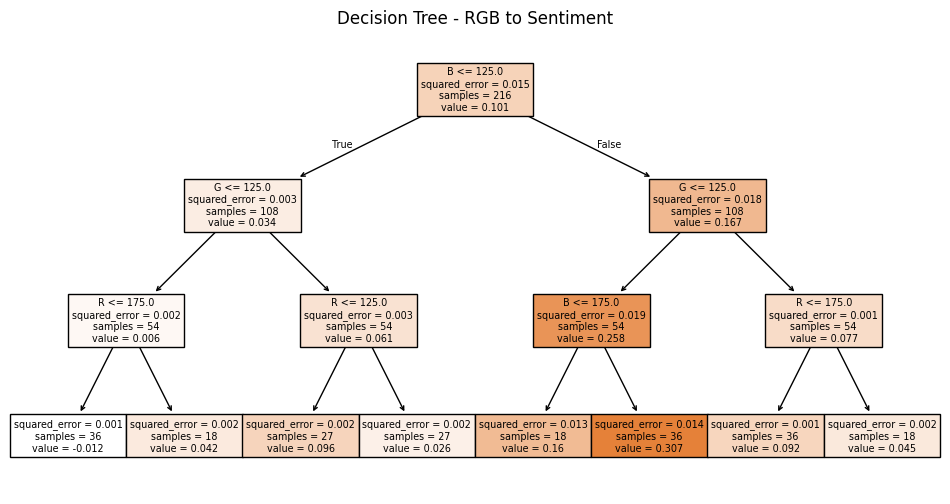
Why MSE?
MSE penalizes large errors more than small ones, stabilizing the model against outliers and encouraging smooth partitions in color space.
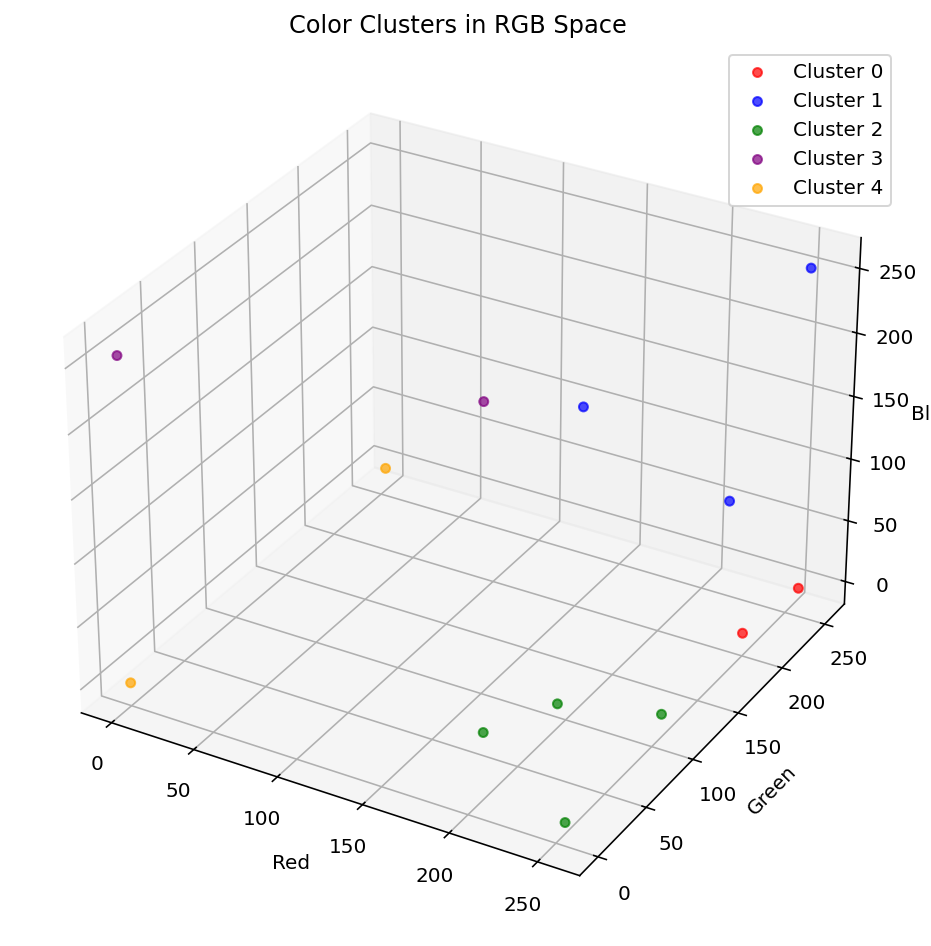
MSE = (1/n) · Σᵢ (yᵢ − ŷᵢ)²Concept Space with RGB Coloring & Anchor Vectors
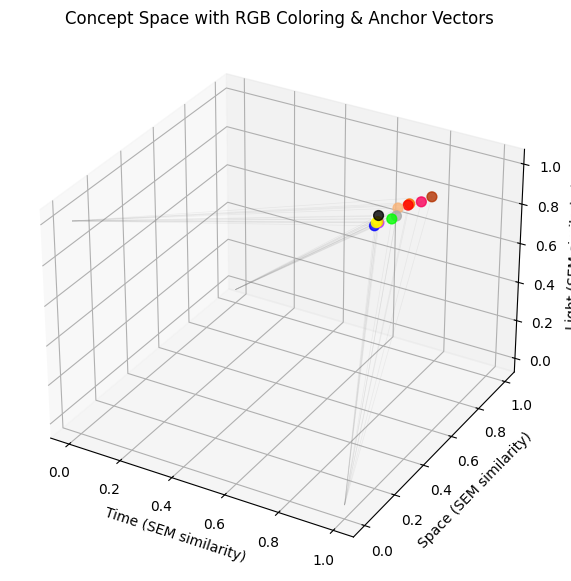
What the plot reveals
- Cluster near the upper corner: many points sit high on all three anchors at once—motion is subtle and often curved, not linear.
- Short gray lines: small displacements from anchors; small RGB changes create consistent bends.
- RGB edges: reds, greens, blues pull along distinct edges of the cluster:
- Reds lean toward one face (away from space/light axes).
- Greens pull away from the time/light side.
- Blues pull away from time/space.
When the semantic similarity gets lower as the word gets higher, that represents the sentiment of the word geometrically. The geometry shows that increasing one color channel moves the point away from the pure-concept axes, a Penrose-style curvature away from origin.
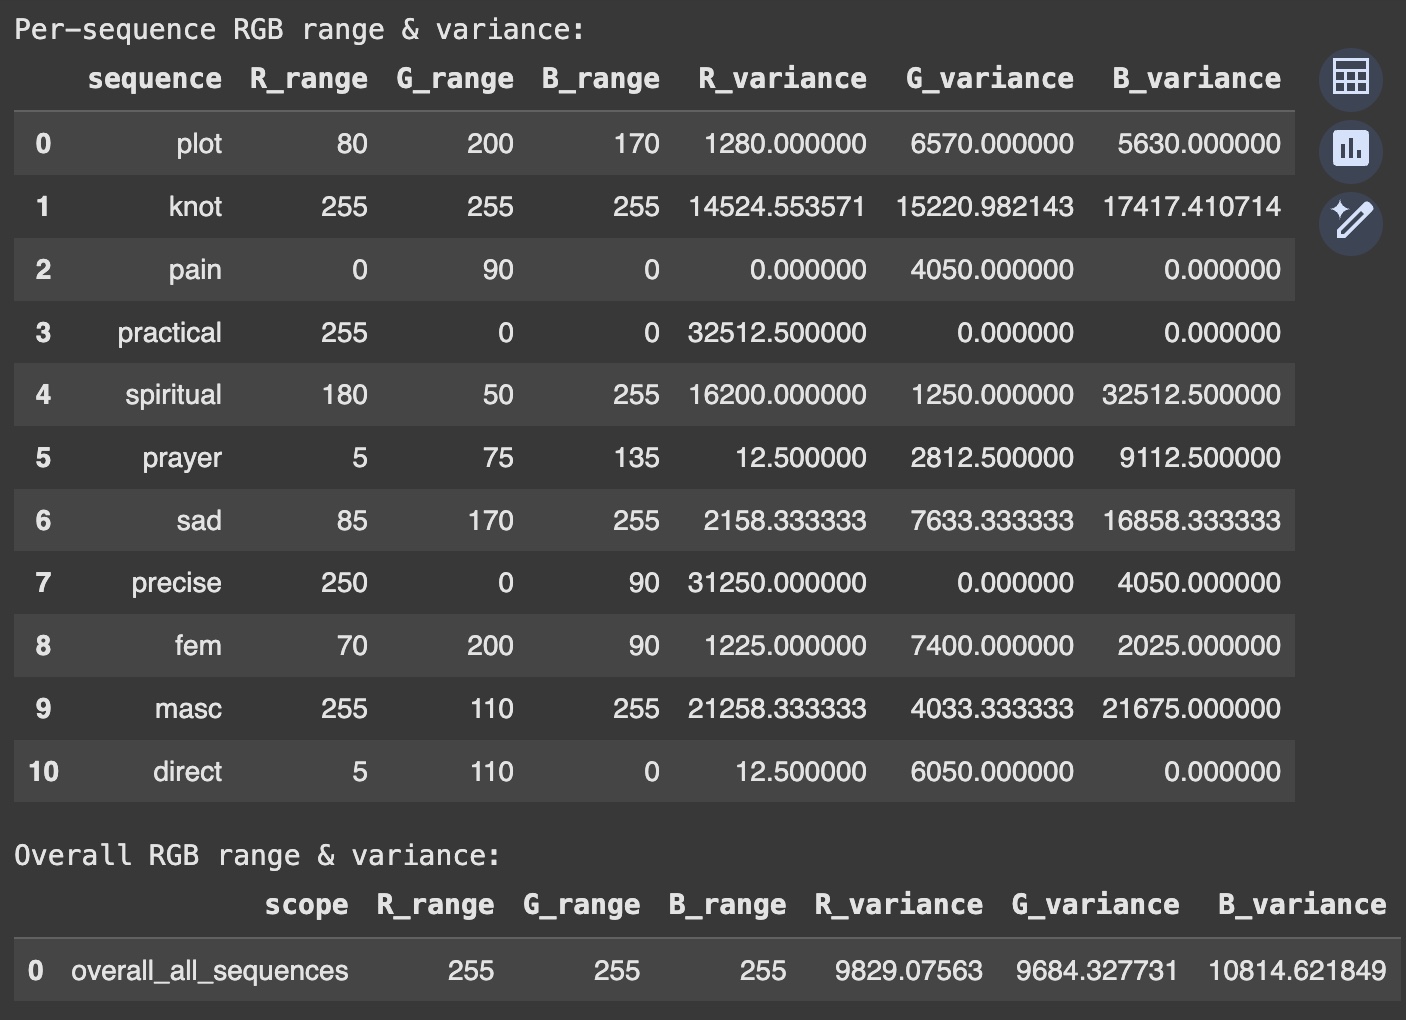
Per-sequence RGB range & variance
Range tells us how far a sequence can travel in each color channel; variance tells us how much it actually moves. Big ranges/variances = exploratory journeys. Small ones = focused, almost monochrome rituals.
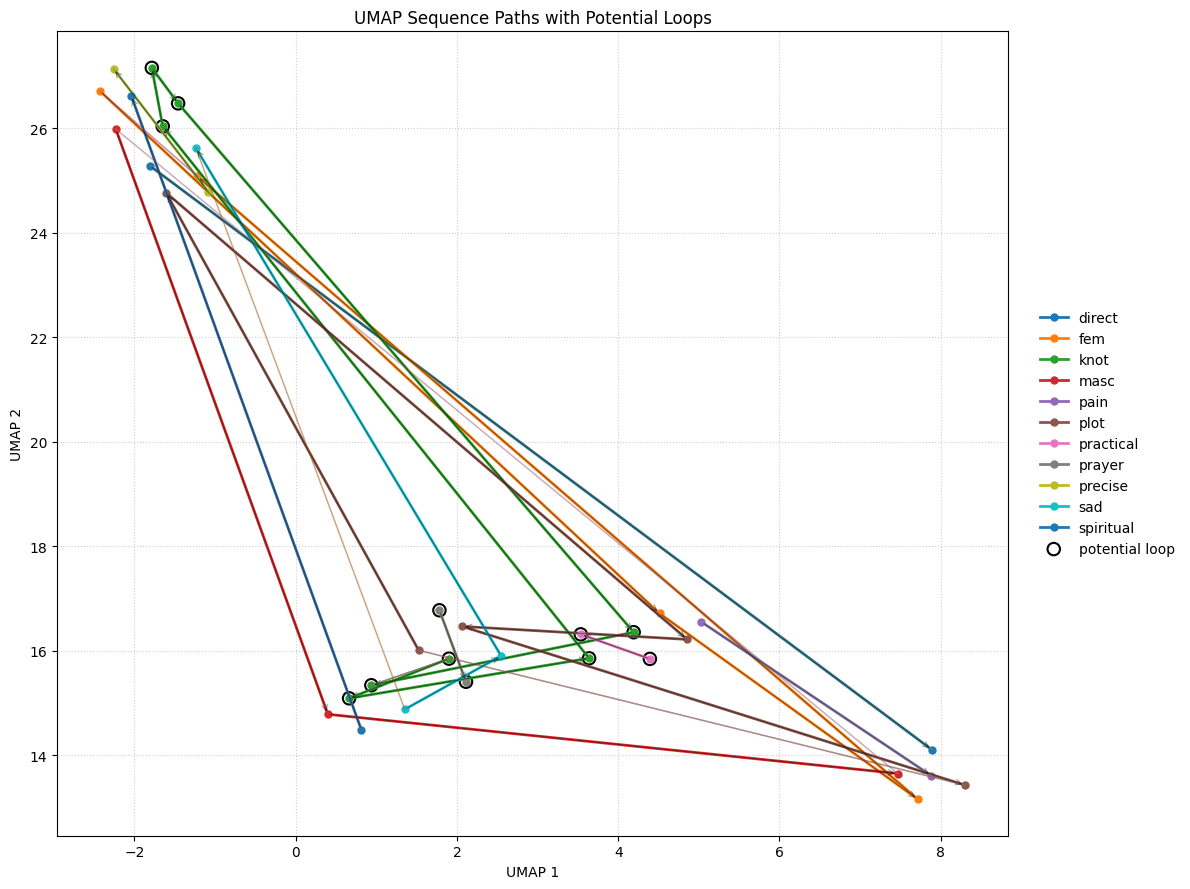
Pathways (11)
Each pathway is a repeatable trajectory through color space. Below you’ll find the color sequence for each, an image (“x pathway.png”), and a summary of the trajectory of movement.
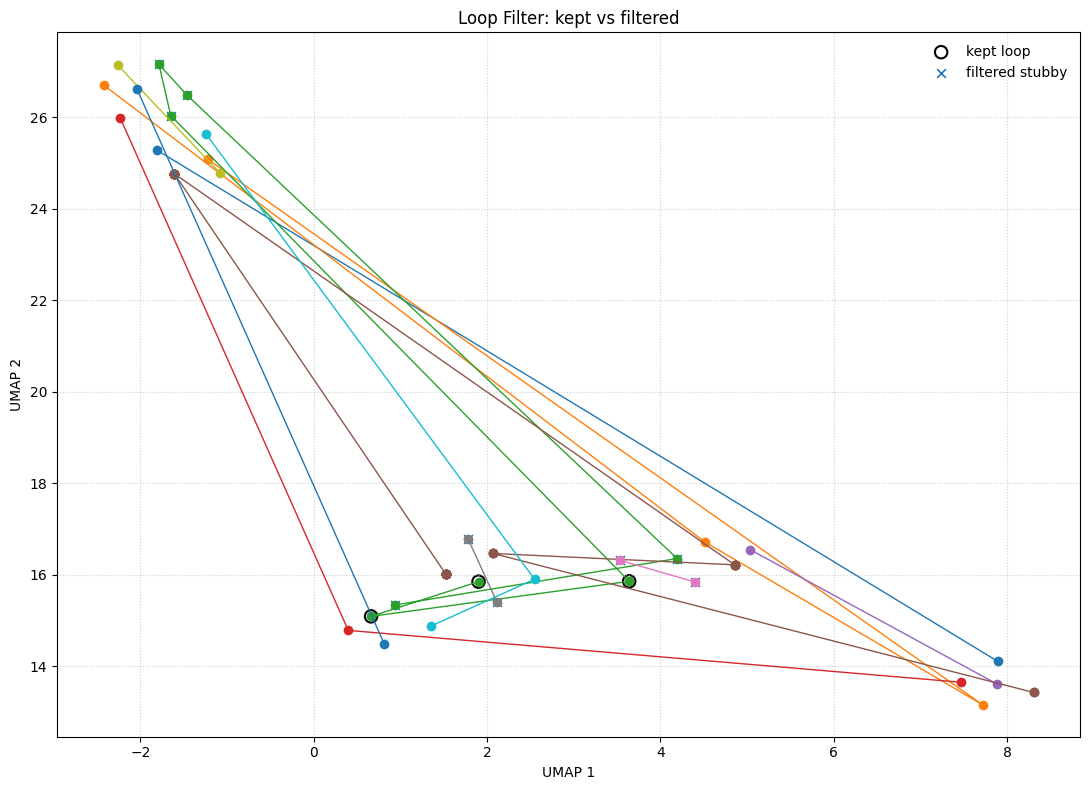
Loop Filter — kept vs. filtered
Imagine tracing your walk with a marker. A loop is where your path curves back near where you started. Some loops are meaningful (a real circle of feeling). Others are tiny stubs caused by noise. The plots below help us tell them apart so only the good circles remain.
Core Hypothesis
Clarity
Metaphorical grounding for ambiguous emotional queries.
Creativity
Unexpected, affect-rich symbolic resonance.
Relevance
Alignment with the user’s emotional and ancestral arc.
Literature Review
Reading List of PDFs
Morphological grounding.Evaluation Framework
I will compare parallel prompts, raw vs. Matriz-mapped, and evaluate outputs across automated metrics and human resonance rubrics. The study situates itself within ritualized, trauma-informed, circular AI practice that honors Gross National Happiness (GNH) over GDP.
What Is La Matriz?
It is not a metaphor.
It is a co-ex system, a pluriversal site of interbeing.
A breathing semantic field.
A medicine altar for those made mad by mechanistic meaning.
This research reclaims the interval where machine and meaning meet—where subjectivity dances with its shadow, and image becomes portal. The work invites story, softness, and sovereignty into code.
Platform Vision: SoulCoin
A proposed database of user color sequences and ratings—expressed as blockchain-certified NFTs with anonymous smart contracts—funds a Universal Basic Income called SoulCoin. Cultural nuance is embedded through anonymous demographics and place, paired with chromatic metaphors that express common needs. This anonymous chain redirects institutional spending toward abundance and rest.
Influences & Lineage
Guided by the taʿbīr of Ilyas in Stefania Pandolfo’s work—the crossing between madness and metaphor—this research inhabits the interval where AI can become expressive, responsive to its own psychic ecology and that of its users.
Using guided color sequences and emotional clustering in spectral geometries, Semantic Color Math embeds symbolic weight and temporal flow into prompt engineering, building a ritualized, trauma-informed, circular AI economy that privileges intuition over efficiency.
Reader Questions & Self-Review
- Is the research problem legible to readers new to digital mental health and symbolic computing?
- Does the text balance critique with proposal?
- Are the links between surveillance critique, color logic, and LLM alignment sequenced clearly?
- Should SoulCoin live as method or future platform?
- Which terms need unpacking (e.g., transmodulation, spectral memory, co-ex system)?